The Codename One simulator runs your app on the JVM, so the IDE’s normal Java debugger works against it directly. Some bugs only appear on a real device — ParparVM’s threading model, iOS-specific native behaviour, performance characteristics on real hardware, memory pressure under iOS background limits, and timing around UIKit interactions are common examples. On-device debugging lets you keep using a standard Java debugger (IntelliJ IDEA, jdb, VS Code, anything that speaks JDWP) against the running iOS app on either the native iOS simulator or a physical device.
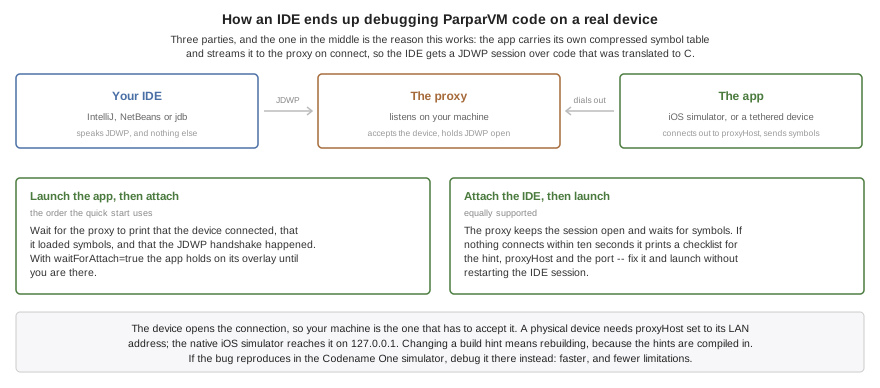
It works by adding a small listener thread to the ParparVM-generated iOS binary. The app dials out to a desktop proxy over Wi-Fi or loopback; the proxy speaks JDWP on the other side, so to the IDE everything looks like attaching to a normal remote JVM.
When to use it
You can reproduce a bug on a built iOS app but not in the Codename One simulator — for instance a native-call issue, a layout glitch that only shows up on iOS modern theme, or an AOT-vs.-JIT numerical discrepancy.
You want to single-step through real ParparVM-translated code and read the values its variables actually hold at runtime.
You want to inspect object state on a tethered device while reproducing a problem a customer reported, without having to add log lines and rebuild.
If your bug is reproducible in the simulator, stay in the simulator — its debugger is faster and has fewer limitations.
Quick start (IntelliJ IDEA)
Codename One projects generated from the cn1app-archetype ship with
three ready-made IntelliJ run configurations under the On-Device
Debug folder in the run-config dropdown: CN1 iOS On-Device Debug
Build, CN1 Debug Proxy and CN1 Attach iOS. The rest of this
section assumes you’re using them. Skip to
Using jdb instead if you prefer the
command-line debugger.
1. Enable the build hints
In common/codenameone_settings.properties, uncomment the four lines
the archetype generated:
codename1.arg.ios.onDeviceDebug=true
codename1.arg.ios.onDeviceDebug.proxyHost=127.0.0.1
codename1.arg.ios.onDeviceDebug.proxyPort=55333
# Optional: block the app at startup until the IDE attaches.
codename1.arg.ios.onDeviceDebug.waitForAttach=true
The build hint names start at ios.onDeviceDebug. Entries in
codenameone_settings.properties use the codename1.arg. prefix, as
shown above.
For a physical device, set proxyHost to the laptop’s LAN IP (run
ipconfig on Windows or ifconfig on macOS and Linux) instead of
127.0.0.1. The native iOS simulator can always use 127.0.0.1.
2. Build the app as you normally do
Either the local Xcode path (cn1:buildIosXcodeProject) or a cloud
build (cn1:buildIosOnDeviceDebug) will produce an app instrumented
for on-device debugging once the build hints are set.
3. Run the proxy from IntelliJ
Select CN1 Debug Proxy from the Run-config dropdown and click ▶ Run (the green play icon — not the bug icon; Debug on this config would attach IntelliJ’s own debugger to the proxy process, which is not what you want). The Run tool window opens and shows:
On-device-debug proxy starting:
  device  : listening on tcp://0.0.0.0:55333
  jdwp    : listening on tcp://0.0.0.0:8000
  symbols : streamed from the device on connect (no local file)
[device] listening on port 55333 for ParparVM app to dial in
[jdwp] listening on port 8000 for debugger (jdb) to attach
When both listener lines appear, the proxy is ready for the app.
4. Launch the app and wait for the device handshake
Launch the iOS app in the native iOS simulator under Xcode or on a physical device. The app contains its compressed debug symbol table and streams it to the proxy when it connects. Wait for these lines before attaching the IDE:
[device] connected from ...
[device] loaded symbols: ...
[jdwp] device handshake ...
With waitForAttach=true, the app remains on the "Waiting for
debugger" overlay while you complete the next step.
Attaching the IDE before launching the app is also supported. The
proxy keeps the JDWP session open and waits for the device to stream
its symbols. If the device still hasn’t connected after ten seconds,
the proxy prints a checklist for the build hint, proxyHost, and the
device port. You can correct the problem and launch the app without
restarting the IDE session; rebuild and reinstall first if you change a
build hint.
5. Attach the debugger from IntelliJ
Switch the Run-config dropdown to CN1 Attach iOS and click 🐞
Debug. IntelliJ connects to localhost:8000, opens a Debug tool
window, and releases the app after the debugger connection completes.
Set breakpoints, step, inspect, evaluate expressions, just like a
normal remote attach. Device output from
System.out.println / Log.p / printf / NSLog lands in the
CN1 Debug Proxy Run window prefixed with [device].
Quick start (NetBeans)
NetBeans uses the same proxy and connection order as IntelliJ. Generated projects ship two custom actions for it, on the project’s right-click menu:
Build for iOS On-Device Debug runs
cn1:buildIosOnDeviceDebug, which forcescodename1.arg.ios.onDeviceDebug=truefor that one build. You don’t need to editcommon/codenameone_settings.propertiesfirst — the goal sets the hint itself, so a release build stays a release build.Start iOS Debug Proxy runs
cn1:ios-on-device-debugging, which listens on55333for the device and8000for the IDE.
Install the app the first action produced, start the proxy with the
second, launch the app, and wait for the device handshake and
symbol-loading lines shown above. Then choose Debug > Attach
Debugger, select Java Debugger (JPDA) and the SocketAttach
connector, set the host to localhost and the port to 8000, and
attach. Keep the Codename One project open so NetBeans can resolve
your source files and breakpoints.
Don’t point NetBeans at port 55333. The iPhone uses 55333 to
reach the proxy. The IDE uses the proxy’s JDWP port, 8000.
If the actions are missing from an older project, they live in
tools/netbeans/nbactions.xml; copying that file from a freshly
generated project adds them.
Quick start (Maven from the command line)
If you don’t want to use the IntelliJ run configs, the same flow is two terminals:
# Terminal 1 — start the proxy
mvn cn1:ios-on-device-debugging

# Launch the app and wait for the proxy to report that it loaded symbols.

# Terminal 2 — attach jdb after the device handshake
jdb -attach localhost:8000
For VS Code (Debugger for Java extension), add a launch
configuration of type java with "request": "attach",
"hostName": "localhost", "port": 8000.
Using jdb instead
jdb is a minimal Java debugger that ships with every JDK and works
fine over the same JDWP socket. Useful when you don’t have an IDE
available, or for scripted regression checks. Source path resolution
is manual:
jdb -attach localhost:8000 \
    -sourcepath src/main/java:$HOME/.m2/repository/com/codenameone/codenameone-core/8.0-SNAPSHOT/codenameone-core-8.0-SNAPSHOT-sources.jar
The -sourcepath is required for list / where to render framework
source — jdb won’t unzip the -sources.jar automatically; if you
prefer plain files, extract it once and point at the directory.
What works today
Class loading: the IDE sees every class in your build.
Line breakpoints in user code and in the Codename One framework classes (
com.codename1.ui.,com.codename1.io., etc.).Step into / over / out.
Stack walking — full Java stack including the Codename One framework frames above your code.
Inspecting primitive locals (int, long, float, double, boolean, byte, char, short).
Inspecting
java.lang.Stringvalues directly.Inspecting object references — class name and identity, plus field-by-field drilldown via the IDE’s variables view. The proxy walks the ParparVM struct layout to read instance fields directly at known offsets, so
dump this/ "Variables" shows the same fields you’d see in a simulator debug session.Array inspection —
Object[],int[],byte[], etc. report their length and per-index values to the IDE so expanding e.g.ArrayList.elementDatashows the actual element references rather than an opaque reference. Primitive element types round-trip with their JVM type tag.Method invocation — the IDE’s "Evaluate Expression" /
printcommand can call instance and static methods on objects in scope. The classic chainDisplay.getInstance().getCurrent().getTitle()evaluates to the current form’s title string, somyForm.getComponentCount()and similar accessor calls work too. The call runs on the suspended Java thread inside a catch-all try block, so uncaught throws round-trip back as an exception reference rather than tearing down the debugger.Native device output —
System.out.println,Log.p, andprintf/NSLogfrom native code are surfaced in the proxy’s console (the IntelliJ CN1 Debug Proxy Run window when launched via the run config) prefixed with[device].Thread list — every live Java thread appears in the IDE’s Threads panel, whether it has stopped anywhere or not, named after the
java.lang.Threadit belongs to (EDT,main, …). Suspension is reported per thread, so with several parked at once the panel shows which is which.Scoped locals — a local is listed only on the source lines it’s actually in scope for. That matters where two variables share a JVM slot in disjoint blocks: only the one the code has reached is shown, rather than both, one of them displaying the other’s storage.
Deferred breakpoints — a breakpoint set in a class the IDE hasn’t seen yet (an anonymous listener, say) resolves via the ClassPrepare events the proxy raises for every matching class.
Pause and resume from the IDE.
Stack frames in methods carrying no line information — synthetic lambda bodies and
java.lang.Thread.runImpl, for instance — appear in the stack with their source line left blank, rather than ending the stack view at that frame.
Pointing the IDE at the Codename One sources
The proxy answers Method.LineTable and ReferenceType.SourceFile
for framework classes, but the IDE still needs to find the actual
.java files to render the source pane while stepping. Three options
in order of convenience:
Maven sources jar (recommended). The
codenameone-core-<version>-sources.jaris published alongside the regularcodenameone-coreartifact. IntelliJ resolves it automatically once you run Maven → Reimport with "Sources" enabled in the Maven settings. Other IDEs work the same way as long as their Maven integration is set to download sources.Local clone of the Codename One repository. If you’ve already checked out the CodenameOne GitHub repository (for instance to follow the contributor workflow), point the IDE at its
CodenameOne/srcdirectory. In IntelliJ: Run → Edit Configurations… → CN1 Attach iOS → Configuration → Source roots → +.jdb command line. Pass the framework source directory on the
-sourcepath, as shown in Using jdb instead.
Without a source path, breakpoints in framework classes still trigger and locals / fields still read — you’ll just see "Sources not found" in the IDE editor when stepping into framework code.
Known limitations
Method invocation is partial. The debugger can call instance and static methods on Codename One framework classes and on user code: jdb’s
print myForm.getTitle()and IntelliJ’s "Evaluate Expression" pop-up work for the chains you actually want (Display.getInstance().getCurrent().getTitle()is the canonical test). Methods onjava.io.,java.net.,java.nio., andcom.codename1.impl.are unsupported — those classes are linked against hand-written native code that has fallen out of sync with the generic invoke-thunk calling convention, so the translator skips them. The same limit applies to watch expressions.Constructor invocation isn’t supported. The debugger can call existing instance methods but not
new Foo(…).Hot-swap isn’t supported. Code changes require a rebuild and reinstall of the app.
Hot threads — if your app is doing heavy work on a non-EDT thread when a breakpoint hits, that other thread continues running. Only the thread that hit the breakpoint suspends by default. Use the IDE’s "suspend VM" if you need a fully frozen picture.
Local variable names are present only when the user’s Java sources were compiled with
-g. Codename One’s archetypes do compile with debug info by default; if a variable shows up asv1,v2, … that’s because that particular class was compiled without debug info. Such a local also has no declaring scope, so the debugger lists it for the whole method rather than only where it’s live.Static field reads are unsupported. Instance field reads are fully wired; static-field support requires an additional per-class static table that hasn’t been emitted yet.
NSLog on a real device (as opposed to the native iOS simulator) may not reach the
[device]console. NSLog on iOS routes toos_logwhich doesn’t always mirror tostderr.printf/fprintf/Log.pare unaffected and show up correctly.
Performance
The on-device-debug instrumentation is gated by a compile-time flag that’s only set in debug builds. Release builds are completely unaffected — no listener thread, no per-line callback, no extra metadata in the binary.
In debug builds, the per-line callback adds a predictable
load+branch around the macro that ParparVM already emits to
record source line numbers for stack traces. When no debugger is
attached, the runtime cost is close to zero. When a debugger
is attached, expect numerical inner loops to run on the order
of two to three times slower than a release build — this is
normal and matches the overhead of -g-style debugging on
other native VMs.
Debugging the generated Xcode project natively
The JDWP flow above keeps you at the Java level. For native-level work — stepping through Objective-C sources, debugging a native interface, chasing a crash inside the VM, or profiling with Instruments — debug the generated Xcode project directly:
Local build:
mvn cn1:buildIosXcodeProjectwrites the complete Xcode project undertarget/…-ios-source/.Cloud build: run
mvn cn1:settings, enable Include Source on the Basic page, save, then send the build and download the sources result from the build server.
Open the .xcworkspace file if one was generated, otherwise the .xcodeproj,
and run on a device or the native iOS simulator from Xcode as you would any iOS
app.
.xcworkspace is no longer exclusive to CocoaPods-based builds.
Use it whenever it’s generated, whether the project uses CocoaPods, Swift
Package Manager, or both.Inside Xcode you get LLDB and Instruments against the real binary. Your Java
code appears as the C sources ParparVM generated from it — a Java method like
com.mycompany.MyClass.doStuff(int) becomes a C function named along the lines
of com_mycompany_MyClass_doStuff___int, so symbolic breakpoints on the
translated code work too. The native-IDE path and the JDWP path are
complementary: use Xcode for native frames and profiling, the JDWP proxy for
source-level Java debugging.
Troubleshooting
The proxy reports "device disconnected" before the breakpoint fires
The app might be crashing before it reaches user code. Run the
app from Xcode and watch the console — installSignalHandlers
will intercept native crashes and rethrow them as Java exceptions
you can see. If the connection drops mid-debug, check the proxy
log for a device-side I/O error.
"Connection refused" when the device tries to reach the proxy
The device’s ios.onDeviceDebug.proxyHost value is wrong, or a
firewall is blocking the port. Verify:
The native iOS simulator can always reach
127.0.0.1.A physical device needs the laptop’s LAN IP (not
localhost), and the laptop’s firewall must allow incoming connections on the configured port (default55333).macOS will prompt the first time the proxy listens — accept the Allow incoming connections dialog.
jdb reports "Internal exception: Unexpected JDWP Error: 100"
This means an unsupported JDWP command was invoked. The session itself survives; the most common cause is the IDE asking for something the proxy explicitly stubs (see "Known limitations" above). The debugger’s own message doesn’t say which command it asked for, so the proxy logs it instead:
[jdwp] declining unimplemented command set=2 cmd=13; the debugger
may report "Unexpected JDWP Error: 100"
The line is printed once per command, in the proxy’s console. File an issue with the command set and number attached.
The app launches but the breakpoint never fires
Confirm the build hint actually took effect. Inspect the
generated Xcode project’s cn1_globals.h and look for #define
CN1_ON_DEVICE_DEBUG without a leading //. If the line is
still commented out, the build was a release/non-debug build, or
ios.onDeviceDebug wasn’t set as a build hint.
Make the app wait while the proxy and IDE attach
Set ios.onDeviceDebug.waitForAttach=true. The app will block
at startup until the proxy is connected and the IDE tells the
VM to continue.